
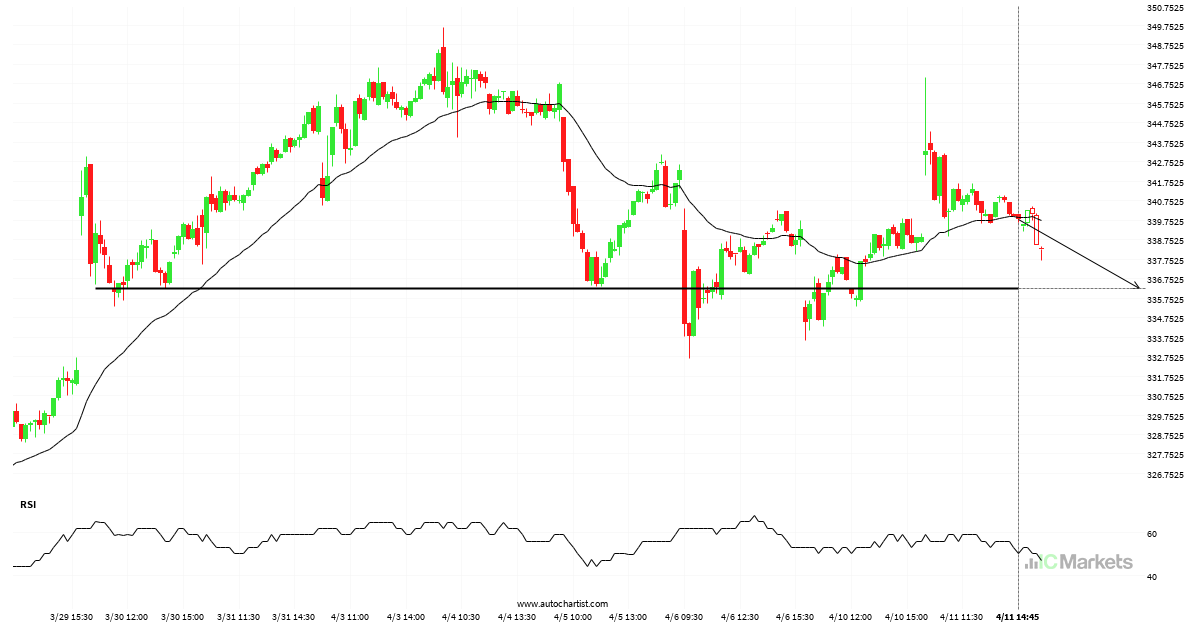
Either a rebound or a breakout imminent on Netflix Inc.
Netflix Inc. is heading towards a line of 336.2400. If this movement continues, the price of Netflix Inc. could test 336.2400 within the next 11 hours. But don’t be so quick to trade, it has tested this line numerous times in the past, so this movement could be short-lived and end up rebounding.
US SPX 500 Index – resistance line breached
US SPX 500 Index has broken through the resistance line of a Baixa Dupla technical chart pattern. Because we have seen it retrace from this line in the past, one should wait for confirmation of the breakout before taking any action. It has touched this line twice in the last 7 days and suggests a […]
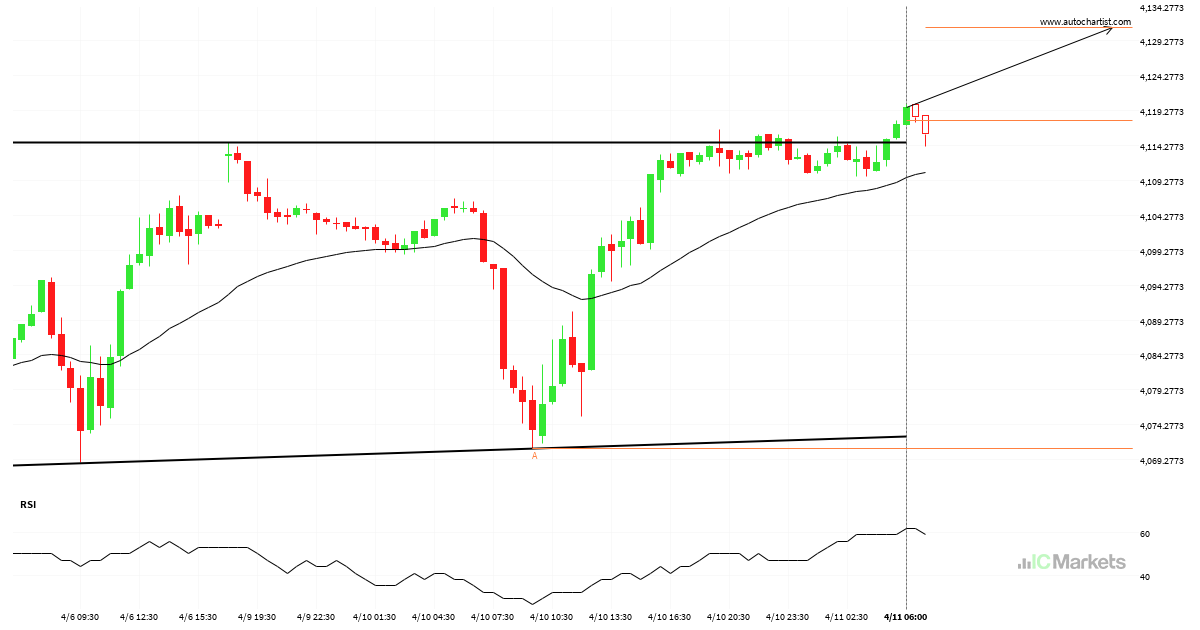
Will US Wall Street 30 Index have enough momentum to break resistance?
US Wall Street 30 Index is heading towards the resistance line of a Triângulo Ascendente and could reach this point within the next 5 hours. It has tested this line numerous times in the past, and this time could be no different from the past, ending in a rebound instead of a breakout. If the […]
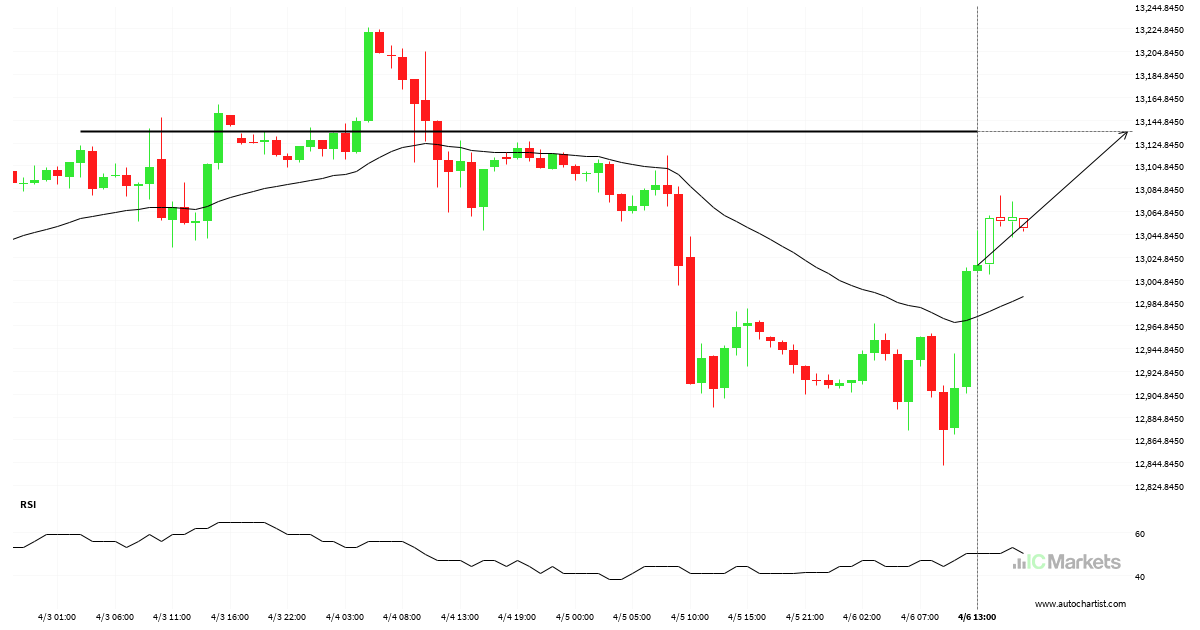
US Tech 100 Index – getting close to psychological price line
US Tech 100 Index is moving towards a resistance line. Because we have seen it retrace from this level in the past, we could see either a break through this line, or a rebound back to current levels. It has touched this line numerous times in the last 4 days and may test it again […]
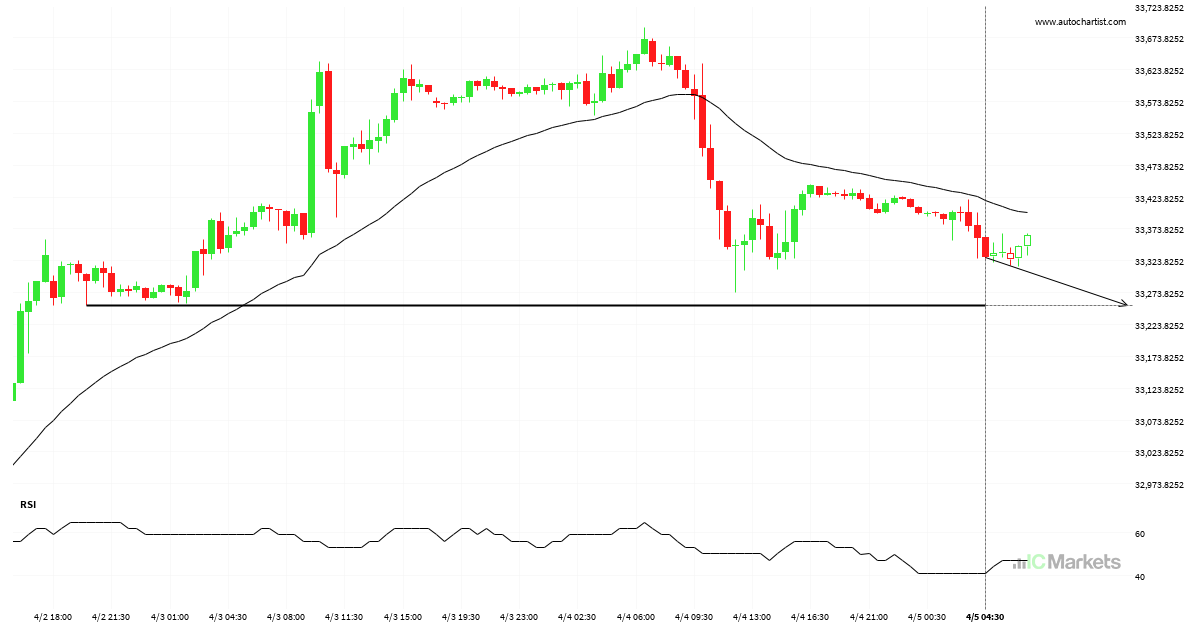
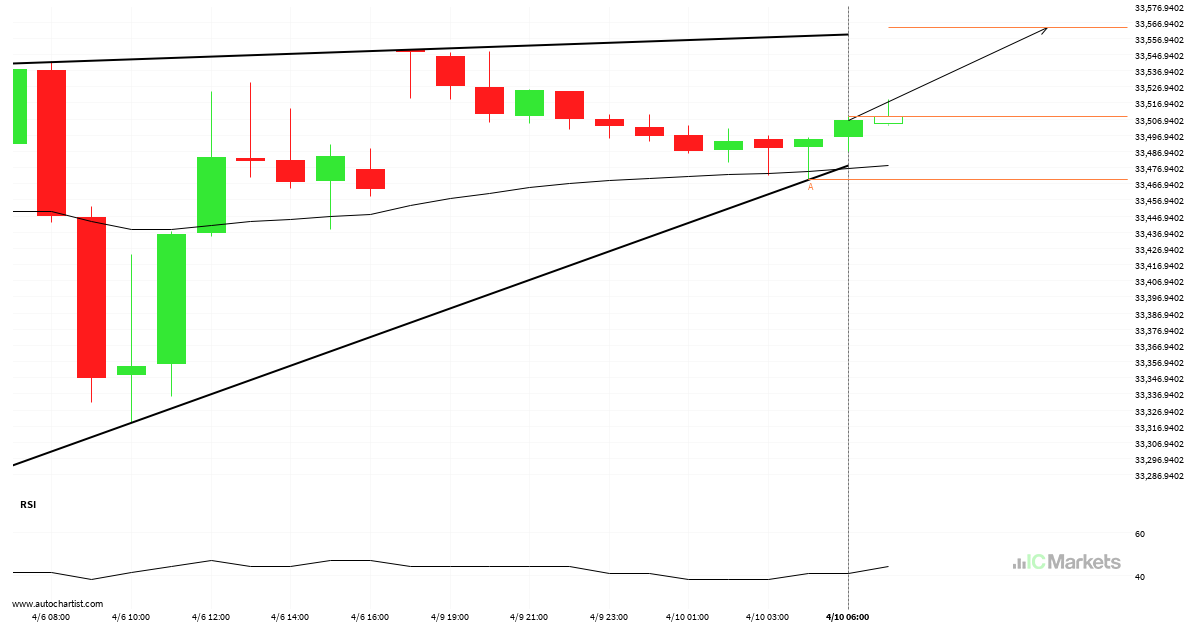
A final push possible on US Wall Street 30 Index
US Wall Street 30 Index is heading towards 33253.1016 and could reach this point within the next 11 hours. It has tested this line numerous times in the past, and this time could be no different, ending in a rebound instead of a breakout. If the breakout doesn’t happen, we could see a retracement back […]
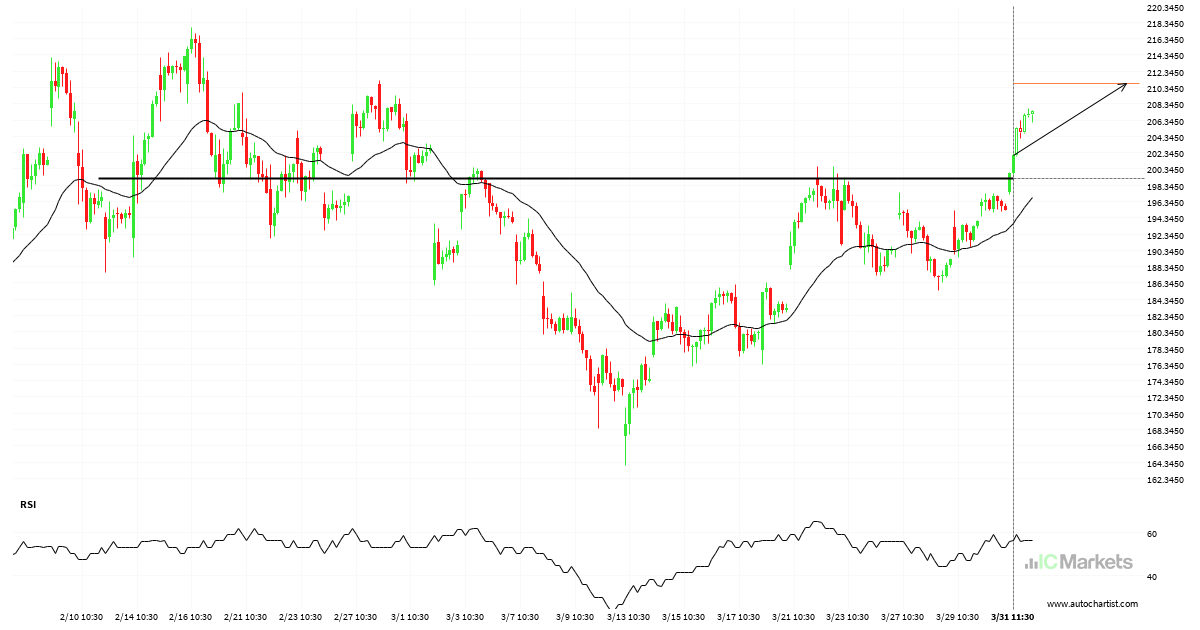
Big movement possible on Tesla Inc.
Tesla Inc. has broken through a line of 199.1000 and suggests a possible movement to 210.8260 within the next 3 days. It has tested this line numerous times in the past, so one should wait for a confirmation of this breakout before taking any action. If the breakout doesn’t confirm, we could see a retracement […]
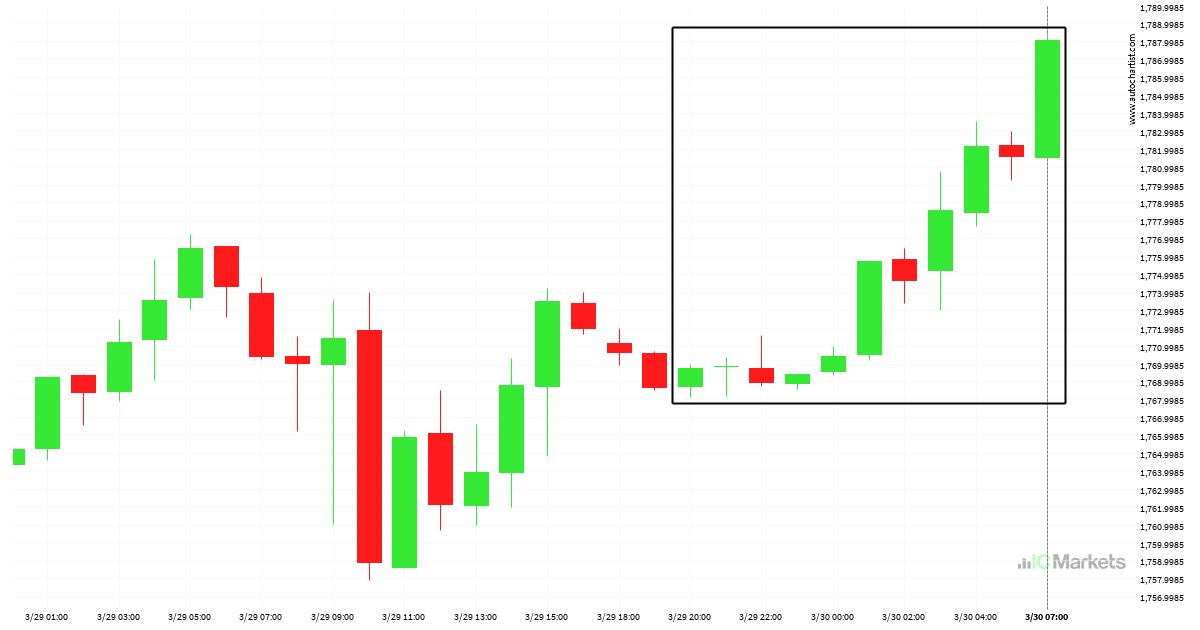
What’s going on with US Small Cap 2000 Index?
Those of you that are trend followers are probably eagerly watching US Small Cap 2000 Index to see if its latest 1,03% move continues. If not, the mean-reversion people out there will be delighted with this exceptionally large 11 hours move.
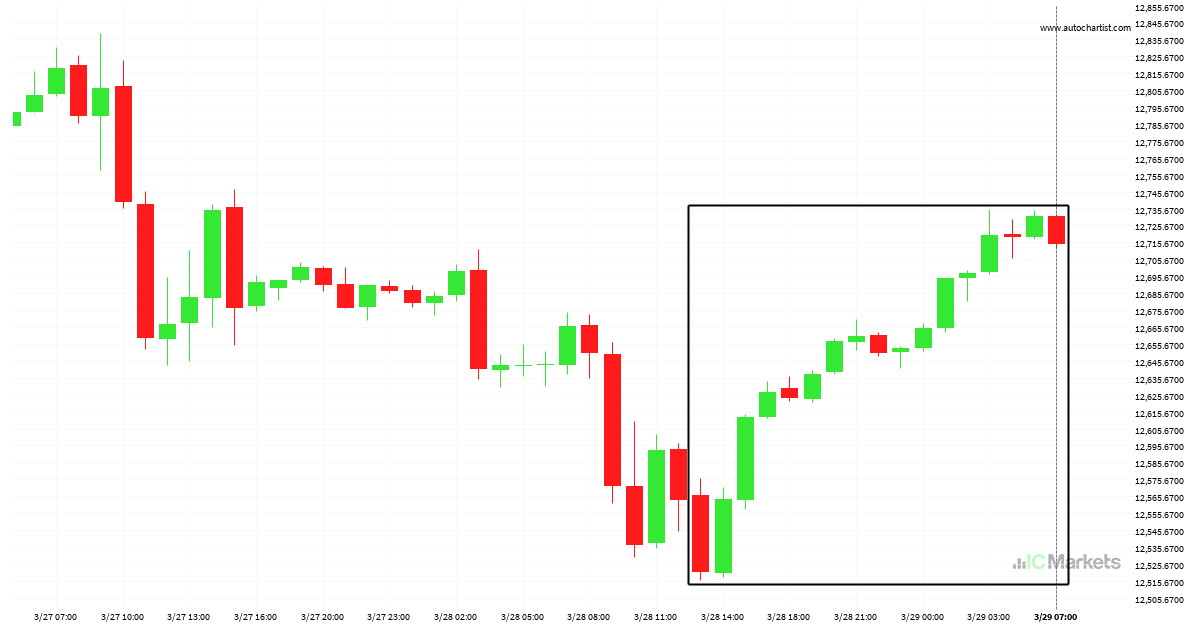
US Tech 100 Index is on its way up
US Tech 100 Index has experienced an exceptionally large movement higher by 1,54% from 12521.1 to 12714.5 in the last 18 hours.
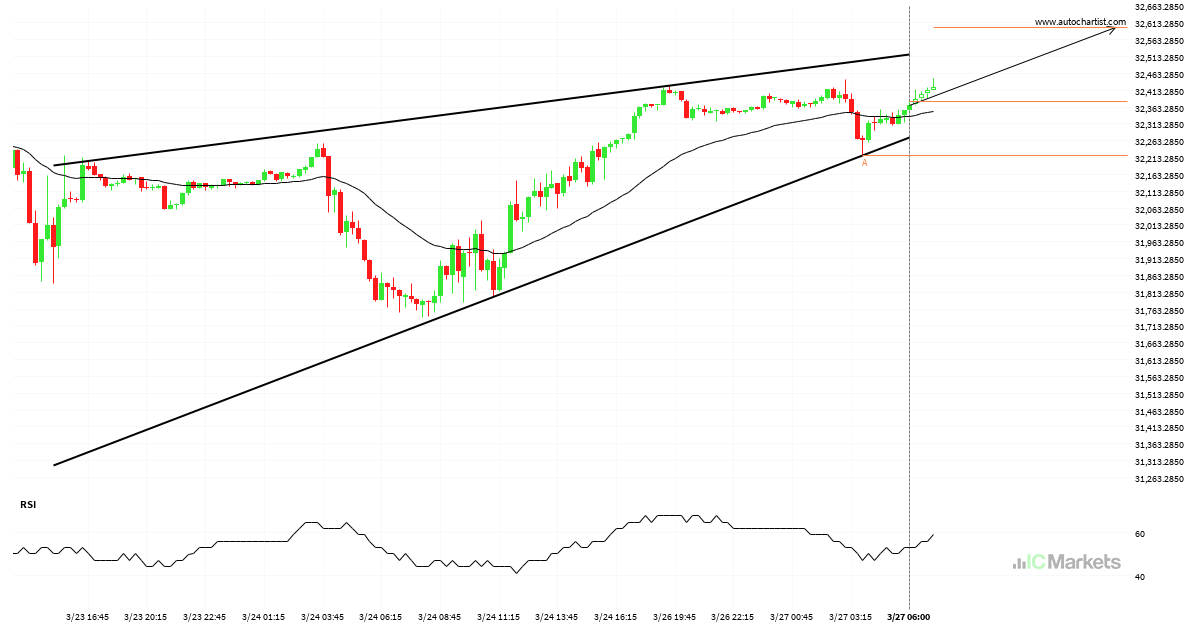
Will US Wall Street 30 Index have enough momentum to break resistance?
US Wall Street 30 Index is heading towards the resistance line of a Cunha ascendente and could reach this point within the next 10 hours. It has tested this line numerous times in the past, and this time could be no different from the past, ending in a rebound instead of a breakout. If the […]
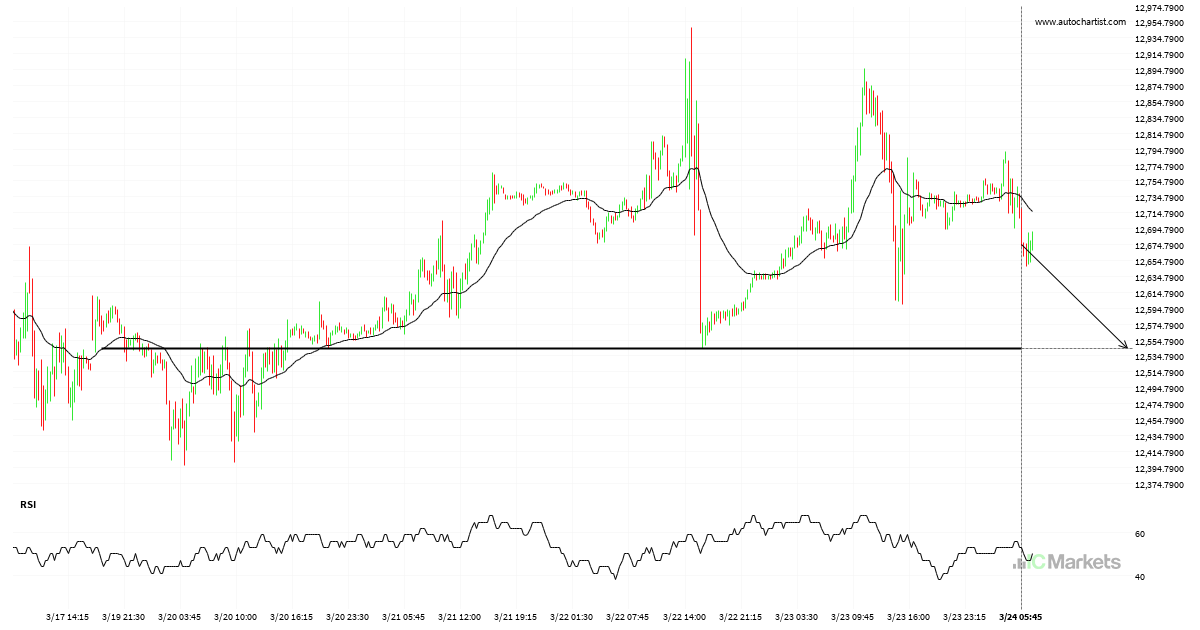
US Tech 100 Index – getting close to psychological price line
US Tech 100 Index is moving towards a support line. Because we have seen it retrace from this level in the past, we could see either a break through this line, or a rebound back to current levels. It has touched this line numerous times in the last 5 days and may test it again […]